3.1 Family Income And Expenditure
| Year | Philippines: Annual Average Income |
Philippines: Annual Average Expenditure |
Region 2: Annual Average Income | Region 2: Annual Average Expenditure | Nueva Vizcaya: Annual Average Income | Nueva Vizcaya: Annual Average Expenditure |
| 2015 | 267,000 | 215,000 | 237,000 | 162,000 | – | – |
| 2012 | 235,000 | 193,000 | 195,000 | 140,000 | 220,000 | 162,000 |
| 2009 | 206,000 | 176,000 | 181,000 | 141,000 | 214,000 | 180,000 |
| 2006 | 173,000 | 147,000 | 143,000 | 118,000 | 168,000 | 153,000 |
| 2003 | 148,000 | 124,000 | 126,000 | 99,000 | – | – |
The annual average income of the province in 2006 was estimated at 168 thousand which is 25 thousand higher compared to the region and 5 thousand lower than the national’s. Similarly, the annual average expenditure of NV on the same year is 153 thousand which exceeds the regional and national figures by 22.88% and 3.92%, respectively.
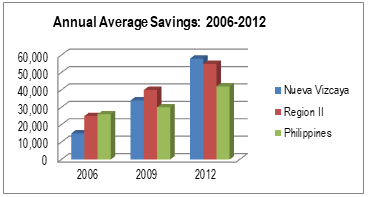
In 2009, the average income and expenditure of the province both escalated by 27% and 17% , respectively, higher than the rate of increase for regional and national level. For year 2012, annual average income of the province surpassed the regional figure by 12.8% but is 6.38% lower than the national average income. Likewise, the annual average expenditure of NV is higher than the region but lower than that of the national’s. Furthermore, from 2006 to 2012, the annual average savings of families on the 3 levels showed a remarkable increase. The provincial annual average savings escalated from 15 to 58 thousand while 25 to 55 thousand for the region and 26 to 42 thousand for the national figure. Generally speaking, Nueva Vizcaya appeared to have the highest rate of increase in comparison to the region and national.
3.2 Labor and Employment
In 2011, the labor force participation rate in the province was 72.7%, 8.1% higher than that of the national’s figure of 64.6%. From the said year, the labor force participation rate of Nueva Vizcaya dropped for 3 consecutive years then increased in 2015 contrary to the national which declined from 2011 to 2013 and escalated in the next year then dropped in 2015.
Nueva Vizcaya generally registered an employment rate higher than the national’s. The highest provincial employment rate was recorded in 2013 at 98.2% which far exceeds the national’s figure of 92.8% by 5.4% disparity. Since the unemployment rate is inversely proportional to the employment rate, NV’s 2013 unemployment rate is at its lowest with only 1.8% in comparison to the national level with 7.2% rate. On the other hand, the number of underemployed persons in the Philippines accounted to more than 18% from year 2011 to 2015 with year 2012 having the highest underemployment rate of 20%. Note that there is no provincial underemployment rate recorded for the past 5 years.